
01 / UNDERSTAND
What is Net Promoter Score?
Net Promoter Score summarises stated likelihood to recommend a product, service or organisation. The familiar question uses a scale from zero to ten. Scores of nine and ten are promoters, seven and eight are passives, and zero through six are detractors. NPS equals the percentage of promoters minus the percentage of detractors.
The result ranges from minus 100 to plus 100. It is a score in points, not the percentage of customers who are satisfied, and it does not directly measure whether a task works.
Why use Net Promoter Score (NPS)?
A repeatable relationship question can expose a shift worth investigating, especially when connected to customers’ explanations. For a designer, the value is not the number alone. Comments and relevant lifecycle context can reveal a gap between an organisation’s promise and the experience people describe. Recommendation intent should remain distinct from observed recommendation or retention.
When to use it
USE IT WHEN
The team needs a repeatable signal about recommendation intent.
Customers have enough experience of the relationship being rated.
There is a practical process for reviewing reasons and responding to relevant issues.
When to choose another method
Use Task Success Rate to measure whether a task is completed.
Use Customer Satisfaction (CSAT) for satisfaction with a defined interaction.
Use User Interviews when you need a fuller account of the relationship.
What you’ll need
Specify the object being recommended, invitation timing, audience and survey channel. Use consistent wording and endpoint meaning across comparisons. Record how many eligible customers were invited and how many answered. Include an optional reason question, but do not require a favourable response for assistance. Decide how comments will be handled and avoid exposing identifiable feedback unnecessarily.
What an NPS measurement contains
Keep the elements that help answer your question and support a decision.
The named product, service or organisation rated.
Audience, channel and point in the relationship.
Zero to ten with clear endpoint meanings.
Promoters, passives and detractors under the standard cutoffs.
Percentage promoters minus percentage detractors.
Volunteered explanations and follow up questions.
02 / PUT IT INTO PRACTICE
How to collect and interpret NPS
Keep evidence and assumptions distinct. Revisit your work when new information changes your understanding.
01
Choose the object
State exactly what relationship the rating concerns.
A repair provider is different from its booking screen.
02
Set timing
Ask at a consistent, relevant point rather than only after favourable interactions.
Include comparable stages of customer experience.
03
Collect consistently
Keep scale, wording and eligibility stable across rounds.
A different channel could change who responds.
04
Report participation
Show valid responses and invitations alongside the score.
Twenty responses from one hundred invitations is a limited view.
05
Calculate categories
Divide category counts by valid ratings and subtract detractor share from promoter share.
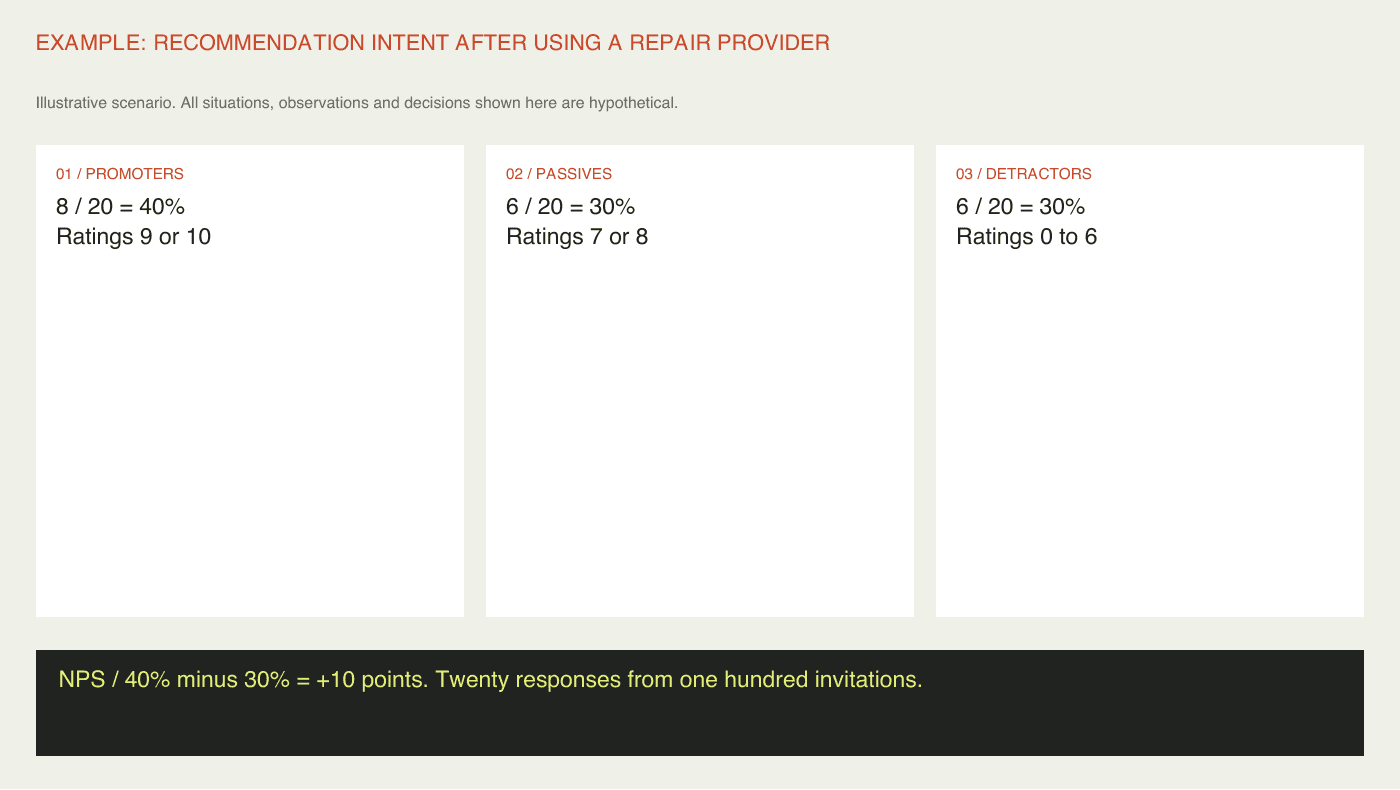
Eight promoters and six detractors among twenty responses gives NPS +10.
06
Read explanations
Review reasons across categories, including passives, without claiming a score diagnoses a specific feature.
A booking complaint can appear in a generally favourable rating.
07
Choose a follow up
Select an experience issue to investigate and specify what additional evidence would support action.
Interview people about missed confirmations rather than redesigning all screens.
Example: recommendation intent after using a repair provider
Fictional scenario: 100 eligible customers are invited and 20 provide valid ratings. Eight are promoters, six are passives and six are detractors. Promoters are 40%, detractors 30%, so NPS is +10 points. All counts are illustrative.
The score card shows participation beside the calculation. Comments mention dependable workmanship and uncertain appointments. These accounts can coexist: the relationship is not one feature, and people weight its parts differently.
The team chooses to investigate confirmation uncertainty across rating categories. A score of +10 does not establish a benchmark or a cause. The example supports reading the distribution and reasons before treating the result as a performance verdict.
03 / BELOW THE SURFACE
Below the surface: a category boundary can magnify a small rating change
The same change in an underlying rating does not always change NPS by the same amount.
POPULATION
Who answered and who is missing?
Show participation and timing.
DISTRIBUTION
Where do ratings sit around the category cutoffs?
Keep raw counts accessible.
MEANING
What would recommending this service actually mean?
Explore relationship context before interpreting intent.
Moving a rating from eight to nine changes a person from passive to promoter. Moving from nine to ten does not change category. In a small sample, one response near a boundary can noticeably change the score without describing a proportionately different experience.
Retain the rating distribution and response counts, not only the headline. When comparing rounds, check who answered and whether uncertainty is large relative to the apparent difference. The compressed score should not replace the underlying observations.
This editorial interpretation also asks whether recommending the service is socially meaningful. Someone may appreciate a specialised repair provider but rarely know another person who needs it. Explore that context without rewriting a standard question and then pretending the result remains directly comparable.
Net Promoter Score (NPS) companion worksheet
The original two page companion documents survey scope, response counts, category arithmetic and reasons. Its second page checks participation, boundary effects and the next investigation. It is not a replacement for the standard NPS question or a claim that the score predicts growth.


Practical tips
Show participation alongside the score.
Read comments from every rating category.
Compare consistent survey conditions.
Common mistakes
Reporting NPS as a satisfaction percentage.
Ignoring passives when reviewing reasons.
Treating a score change as proof that one interface caused it.
What you’ll get
A correctly calculated recommendation intent score with a traceable response population. Use the reasons to focus investigation and judge improvements with evidence relevant to the actual experience.