
01 / UNDERSTAND
What is a Customer Journey Map?
A customer journey map visualises how a specific person experiences a product or service while trying to achieve a goal. It connects stages, actions, touchpoints, needs and evidence of friction, helping a team decide where to investigate or improve the experience.
The map is built from the user’s perspective, not the organisation’s process. Its strongest version draws on interviews, observations, support conversations and other evidence. Where evidence is missing, mark the gap rather than filling it with a guess.
Why map the journey?
Experiences rarely fit neatly inside one screen or team. A journey map brings scattered observations into a shared view, so designers, researchers and service teams can see where a person’s needs meet or miss what the service provides.
It helps the team identify critical moments, discuss opportunities with evidence and agree where to focus next. The map itself is a starting point for decisions, not the finished solution.
When to use a Customer Journey Map
USE IT WHEN
An experience spans several stages, channels or teams.
You need to see how a specific group of people moves from an initial need to an outcome.
Research findings feel fragmented and the team needs a shared picture of pain points and opportunities.
When to choose another method
You need to evaluate how people complete a specific task in an interface. Use Usability Testing.
You have no user evidence yet. Start with User Interviews or observation; keep an assumption map provisional.
You need to connect customer touchpoints to staff, systems and backstage processes. Use a Service Blueprint.
You are exploring an experience across providers, beyond one product or service. Use an Experience Map.
You need to organise product functionality and plan releases. Use a User Story Map.
What you’ll need
Start with a defined user, a specific scenario, one goal and clear start and end points. Bring research evidence, such as interviews, observation notes, support tickets or analytics, and invite people who understand different parts of the experience. A shared canvas helps, but a clearly defined question matters more than the format.
Choose the map’s purpose before filling the canvas: a current-state map describes the experience today; a future-state map proposes an experience to design and test. Label a map built from team assumptions as a hypothesis and use it to plan research.
What goes into a journey map?
Keep the elements that help answer your question and support a decision.
Who this is about, what situation they face and the outcome they are trying to reach.
The main parts of the experience, described in the user’s language.
What the person does and where they interact with people, channels or systems.
What they are trying to achieve or understand at each point.
Where the experience breaks down, supported by observations or quotes. Include emotions only when research supports them.
Places to improve the experience that can be investigated next.
02 / PUT IT INTO PRACTICE
How to create a Customer Journey Map
Keep evidence and assumptions distinct. Revisit your work when new information changes your understanding.
01
Define the scope
Choose the experience, its start and end points, and the decision the map should support. State whether you are mapping today’s experience or proposing a future one.
In practice: Keep the scope narrow enough to investigate. “Booking a first appointment” is more useful than “the entire customer relationship”.
02
Select the user
Choose an audience or persona grounded in research whose experience you want to understand.
In practice: Build separate maps when different groups have substantially different journeys.
03
Define the scenario
Name the specific situation, its trigger and the goal the user is trying to achieve.
In practice: The same person may have very different journeys when booking, rescheduling or seeking help. Map one scenario at a time.
04
Map the stages
Outline the major stages people move through, using language that makes sense from their perspective.
In practice: Start with a rough sequence. Let research change it.
05
Add actions and touchpoints
Record what people do, the channels they use and who or what they interact with at each stage.
In practice: Include interactions outside your product, such as asking a friend or calling support.
06
Add needs and pain points
Connect each stage to observed needs, questions, emotions and obstacles.
In practice: Attach evidence. Mark assumptions clearly instead of presenting them as research findings.
07
Identify opportunities
Translate repeated pain points and unmet needs into opportunities for improvement.
In practice: Describe the need before jumping to a feature or solution.
08
Review the journey
Review the map against research with people who know the experience. For each priority opportunity, agree on an owner, a next action and the evidence needed to judge the result.
In practice: Record the research date and unresolved questions. Return to the map when new evidence or a service change affects the journey.
Example: booking a first appointment
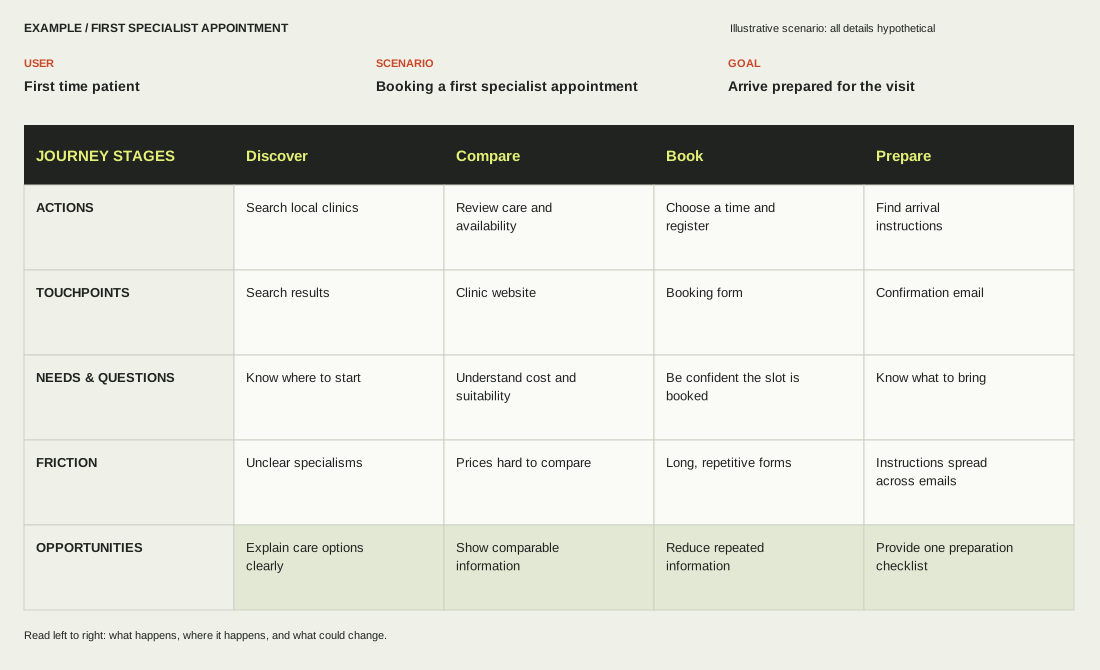
For this example, the user is booking their first appointment with a specialist. Their scenario starts when they decide to seek care and ends when they are prepared to attend the visit. It illustrates the structure of a completed map; the details are hypothetical, not research findings.
Discover: the person searches for local clinics but cannot tell which specialism fits their need. The opportunity is to explain care options clearly.
Compare: the person checks clinic websites for suitability, availability and cost. Information that is hard to compare suggests testing a consistent presentation of these details.
Book: the person chooses a time and registers. A long form asks for repeated information; investigate which entries can be removed or reused.
Prepare: the person looks through confirmation emails for arrival instructions and what to bring. A single preparation checklist is a possible improvement to test.
To turn the last stage into a decision, ask first-time patients to find the arrival information using the current emails. Then test a checklist and compare whether they can locate the same details. Record the evidence before recommending a change; this scenario does not demonstrate an actual improvement.
03 / BELOW THE SURFACE
Go deeper: expectations and recovery
A low point is not always the most consequential one. A small mismatch can matter more if someone was promised certainty and has no way to recover when it fails. Once the basic journey is mapped, choose one critical moment and look beneath the visible pain point.
01 / EXPECTATION
What did the user think would happen?
Trace the expectation back to the message, promise, touchpoint or familiar pattern that set it.
02 / REALITY
What happened, and what produced the gap?
Separate the observed experience from a suspected cause. Mark uncertain claims before testing.
03 / RECOVERY
How can they get back on track?
Look for a visible status, a clear alternative or a person who owns the repair.
For example: an appointment form implies immediate confirmation. After submitting it, the person sees no booking status. The opportunity may be a clear confirmation and recovery path, rather than simply shortening the form. This is a hypothesis to validate, not an observed finding.
Mark each claim as observed, reported or inferred. These prompts are an original Design Iceberg editorial synthesis for discussing opportunities. They are not a validated model or a claim to have invented journey mapping.
Customer Journey Map template
Use the branded canvas on two pages to map the scenario and its stages, then investigate one critical moment with the optional expectations and recovery layer. Keep your evidence visible as you work.


Practical tips
Use the user’s language for stages and needs.
Keep evidence and assumptions visibly separate.
Include the moments between digital interactions.
Choose opportunities the team can investigate or act on.
Common mistakes
Mapping an imaginary “average user”.
Inventing emotions without supporting evidence.
Making the journey so broad that it cannot guide decisions.
Finishing the map without assigning a next step.
What you’ll get
A shared view grounded in evidence of the experience: the moments that matter, the pain points worth investigating and the opportunities the team can prioritise. Keep it available as a reference for future research and design decisions.
Sources and references
Marc Stickdorn, Markus Edgar Hormess, Adam Lawrence and Jakob Schneider. This Is Service Design Doing (2018).
Jim Kalbach. Mapping Experiences (2016).
Nielsen Norman Group. Journey Mapping 101.
Sarah Gibbons, Nielsen Norman Group. UX Mapping Methods Compared: A Cheat Sheet (2017). Reference for choosing a mapping method and distinguishing current-state, future-state and hypothesis maps.
This guide is an original practical summary, not a reproduction of these publications.