01 / UNDERSTAND
What is cohort analysis?
Cohort analysis groups people by a shared entry event or characteristic and follows their behaviour over time. It helps distinguish changes within a group from changes in the mixture of people using a service. Compare groups at the same age, rather than treating all activity in a calendar month as equivalent.
Acquisition cohorts might start at the first completed booking. Behavioural cohorts might share an early action. These choices answer different questions and must be recorded explicitly.
Why use Cohort Analysis?
An aggregate retention number can rise because established customers make up more of the audience, while the experience for new customers deteriorates. Cohorts make that composition visible. For a designer, the useful question is often when a specific group stops receiving value and what changed around that point, rather than whether the overall chart is moving upward.
When to use it
USE IT WHEN
Different intake groups appear to experience onboarding differently.
The team needs to compare returning behaviour after a product change.
An aggregate metric may be hiding a change in audience composition.
When to choose another method
Use Funnel Analysis to locate loss within a defined sequence.
Use User Interviews to understand why people return or stop.
Use A/B Testing when you need stronger evidence of a causal effect.
What you’ll need
Choose an entry event, a return event and an interval suited to the service cadence. Check identity changes, deleted accounts and missing tracking. Identify when the data was collected so younger cohorts are not treated as if they have completed the whole follow up period. Ask what returning means: a repeated complaint is activity, but may not be value.
What makes cohorts comparable
Keep the elements that help answer your question and support a decision.
The event or characteristic that defines cohort membership.
The original denominator, including eligibility exclusions.
Days, weeks or months since the entry event.
The specific behaviour counted as retention.
Which intervals have had time to occur.
Season, channel, changes and other differences between groups.
02 / PUT IT INTO PRACTICE
How to run a cohort analysis
Keep evidence and assumptions distinct. Revisit your work when new information changes your understanding.
01
Choose a decision
Name what comparison would change a design or research choice.
Ask whether new subscribers reach a useful second repair booking.
02
Define membership
Use a stable rule and avoid moving people between groups after seeing outcomes.
Assign subscribers by their first completed booking month.
03
Set the return event
Count meaningful value and distinguish it from any logged activity.
A completed repair is more relevant than opening a reminder.
04
Align cohort age
Compare equivalent intervals from entry and mark unobserved cells as unavailable.
Do not compare month two for January with month two for a recent March cohort.
05
Compute and audit
Show cohort sizes and interval counts before converting them to percentages.
Thirty of fifty January subscribers return in month one: 60%.
06
Investigate differences
Check seasonality, acquisition mix and service capacity before attributing a change to design.
A marketing campaign may recruit people with different repair needs.
07
Decide the next test
Use the pattern to focus qualitative research or a controlled comparison.
Investigate the first repeat booking experience with recent subscribers.
Example: returning to a repair subscription
Fictional scenario: January and February each bring 50 new repair subscribers. Thirty January subscribers complete another booking in month one; 20 February subscribers do so at the same age. The illustrative rates are 60% and 40%. February month two is not yet observable.
The team marks the missing cell as unavailable rather than zero. It also records that February recruitment used a different offer. The difference therefore raises a question about expectations and repeat value; it does not prove a new onboarding design harmed retention.
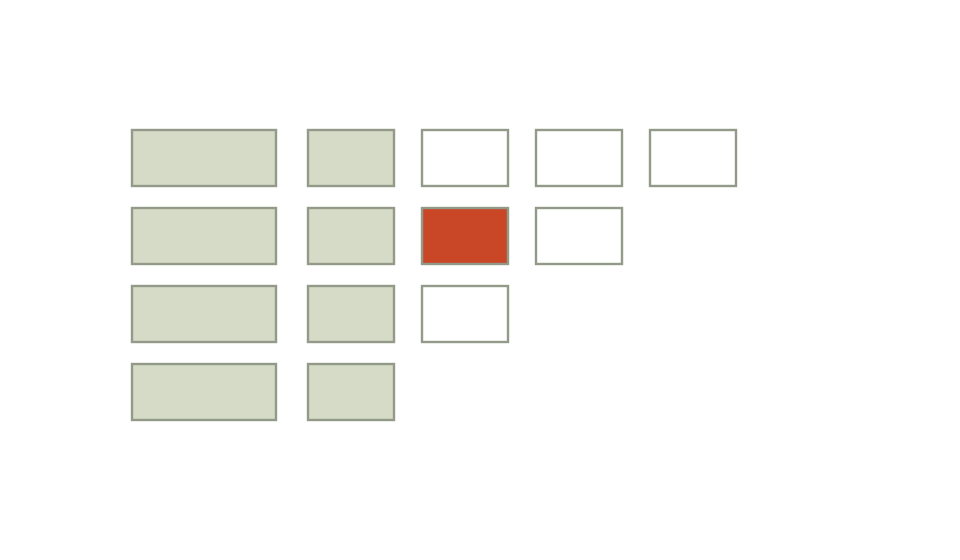
A compact heatmap shows cohort size, age and counts together. An adjacent note identifies the changed offer and the unobserved horizon. The next action is to investigate the difference, not to roll back a design solely because two percentages disagree.

03 / BELOW THE SURFACE
Below the surface: a behaviour can define both the group and its apparent success
Selecting cohorts by an early action can make an association look like a product effect.
AGE
Have both groups had equal time to return?
Mark incomplete observation explicitly.
SELECTION
Who was more likely to perform the defining action?
Consider motivation and opportunity.
VALUE
Does returning represent useful progress?
Check repeated problems and seasonal need.
People who complete setup may already have stronger motivation, more time or a more suitable need. If they later retain better, encouraging setup might help, but the cohort comparison alone cannot establish that. Membership was not randomly assigned.
There is also a timing problem: a person must remain long enough to perform the action used to enter a behavioural cohort. Comparing them with everyone else from signup can give the selected group an unfair period of survival. Align eligibility and the point when membership can be known.
For an exploratory comparison, define an early observation window and compare subsequent behaviour among people eligible at its end. Record the population this excludes. For a causal decision, consider a suitably designed experiment. This interpretation check keeps a useful pattern from becoming an unsupported intervention claim.
Cohort Analysis companion worksheet
The original two page companion records membership, denominators, return events and observation horizons. The review page checks selection and timing before recommending an investigation. Build a heatmap or cohort query separately; keep unobserved intervals distinct from zero returns.


Practical tips
Show the initial group size next to each row.
Choose intervals that fit the natural service cadence.
Keep membership definitions stable across reviews.
Common mistakes
Comparing calendar months without aligning cohort age.
Replacing unobserved intervals with zero.
Treating an early behaviour as a proven cause of retention.
What you’ll get
A comparison of behaviour at equivalent ages, with important differences named. Use it to choose where to investigate value or test an intervention; retain the definition so the next review is comparable.